The Manchester T: new analysis reveals city's most liveable areas
New data from Liveable.co.uk uncovers the T-shaped corridor that defines Manchester's most desirable neighbourhoods.
Liveable.co.uk, the UK's leading platform for local area insights, today reveals the "Manchester T" - a distinctive T-shaped corridor across Greater Manchester that represents the most liveable places to live in 2025.
Interactive Map Comparison
Drag the slider to compare the Manchester T pattern
The findings follow September's viral discussion of the London Banana and highlight the areas where Manchester's quality of life is at its strongest.
The Manchester T - Liveable Areas 2025
| Area | Liveable Score | Avg House Price |
|---|---|---|
| Altrincham | B+ | £587,672 |
| Ancoats | A | £381,354 |
| Bowdon | B+ | £645,508 |
| Bramhall | B+ | £440,526 |
| Brooklands | B+ | £394,456 |
| Cheadle Hulme | B+ | £407,835 |
| Chorlton | A | £447,741 |
| Didsbury | A | £576,468 |
| Hale | B+ | £593,589 |
| Heaton Mersey | B+ | £403,605 |
| Timperley | B+ | £516,919 |
| West Didsbury | A | £635,284 |
House Price Data Source: Office for National Statistics (Median house prices by Middle layer Super Output Area), 2024.
The Hidden Gems of the Manchester T
While the Manchester T includes some of the region's most premium addresses, the analysis also highlights several areas that combine strong Liveable scores with more accessible property prices:
Brooklands (Trafford) – At £394,456, this Metrolink-connected suburb offers excellent value given its proximity to the city centre and family-friendly character.
Cheadle Hulme (Stockport) – With an average of £407,835, this area combines strong schools, good transport links, and a lively high street.
Heaton Mersey (Stockport) – Averaging £403,605, this neighbourhood offers both green space and easy train access, making it one of the most balanced value-for-money spots in the T.
Bramhall (Stockport) – Though slightly higher at £440,526, Bramhall's village feel, parks, and direct rail links make it an attractive alternative to Trafford's priciest postcodes.
Chorlton (Manchester) – At £447,741, this area offers greater value compared to nearby Didsbury. Its bohemian atmosphere, independent shops, and Metrolink connection make it a cultural hotspot that punches above its price point.
Together, these areas show that living within the Manchester T isn't limited to premium postcodes. Value still exists, particularly around the £400k mark.
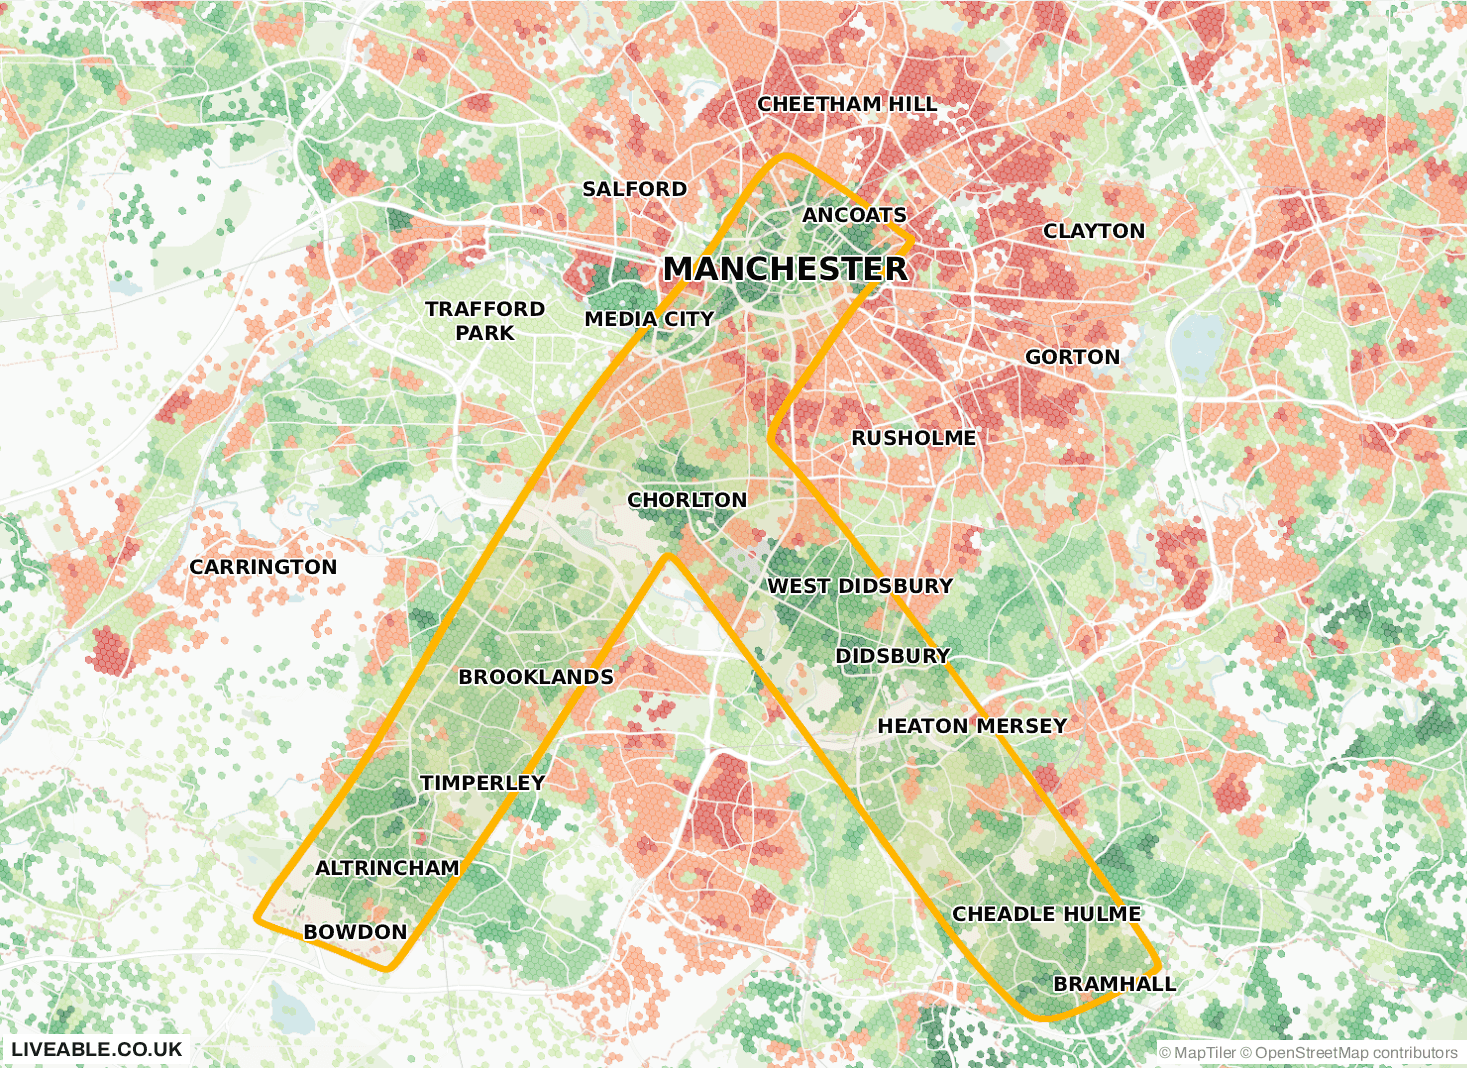
The Manchester T has been identified using the Liveable Score, a data-driven measure of local desirability. Based primarily on UK Census data, the score considers factors such as home ownership, education, employment levels, and occupational class (NS-SEC). Liveable's algorithm maps results at a hyper-local level, revealing patterns of desirability that are invisible in broader statistics.
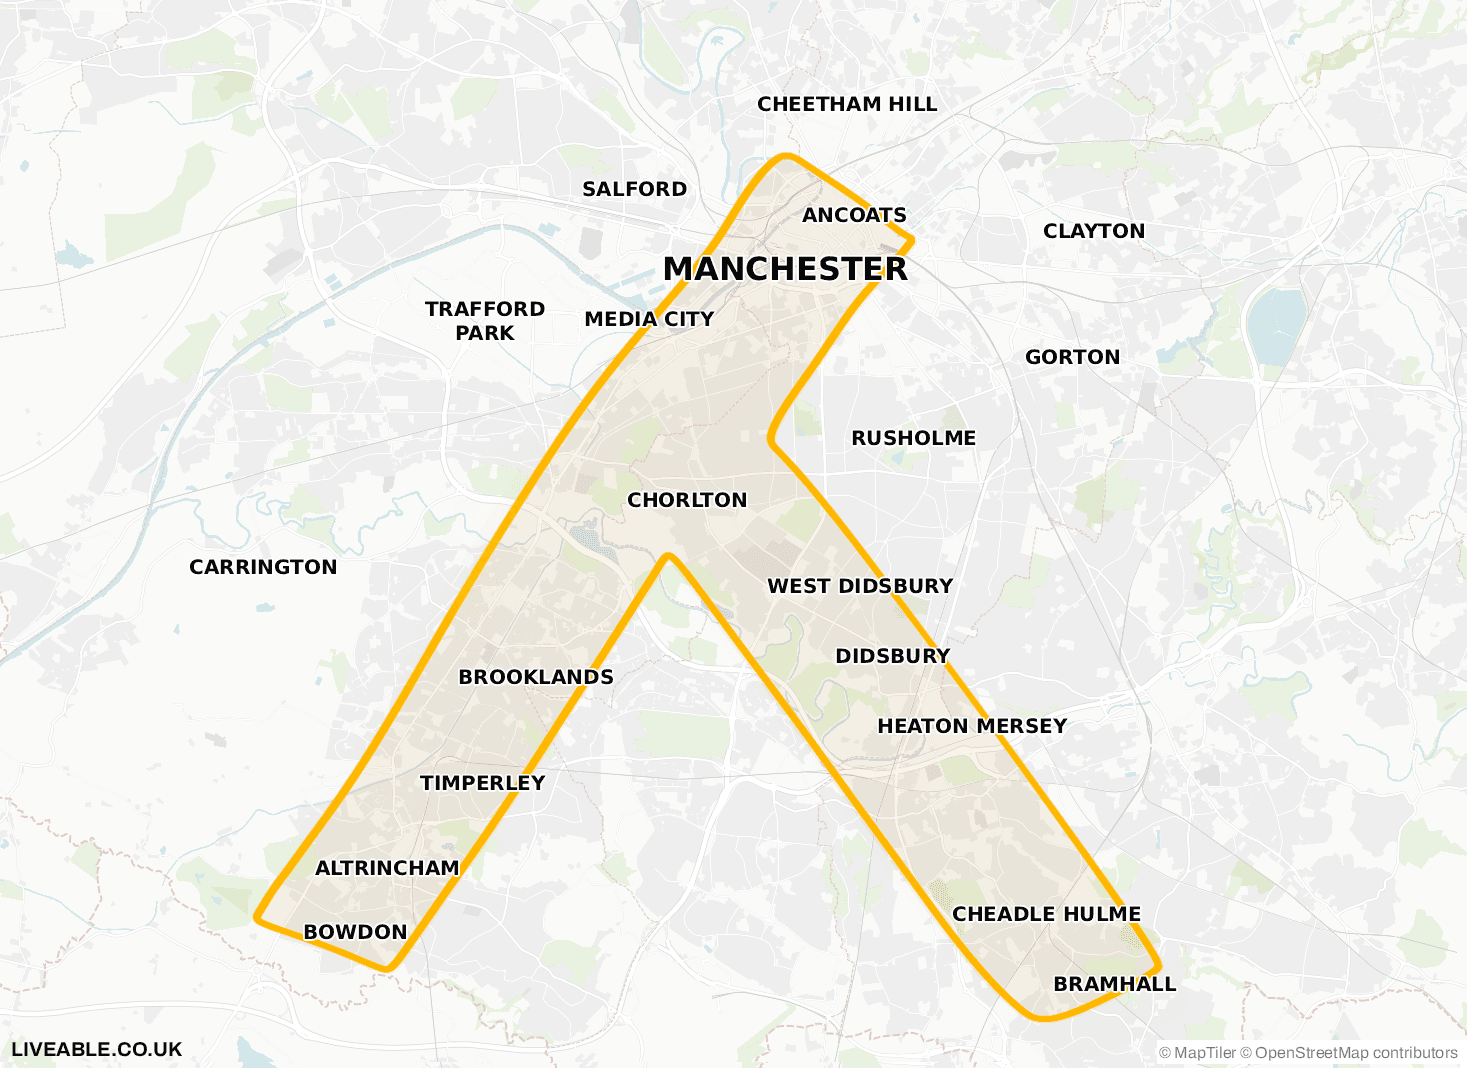
The analysis shows that Manchester's highest-scoring neighbourhoods cluster in a striking "T" shape, running from Ancoats and Deansgate through to Altrincham, with a southern stem extending through Didsbury and out to Bramhall.
"The Manchester T shows how desirability tends to cluster and spread. When certain areas become established as the best places to live, neighbouring communities often benefit too. For anyone choosing where to move, being within or near the T is a great choice for long-term liveability."
— Andrew Hammond, founder of Liveable
Key Findings
Transport is king – The T closely mirrors Manchester's tram and rail corridors, underlining how connectivity drives liveability.
City centre hotspots – Ancoats, Deansgate and MediaCity form the hub of the T, combining jobs, nightlife and culture.
Southern lifestyle pull – Altrincham, Didsbury and Bramhall dominate for family-friendly appeal, strong schools and green space.
Premium addresses with hidden value – While areas like Bowdon and West Didsbury command some of the highest house prices in the region, several neighbourhoods within the T, such as Brooklands, Cheadle Hulme and Heaton Mersey combine strong Liveable scores with average prices closer to £400k, suggesting they offer greater value-for-money.
A simple shape that reveals future potential – The Manchester T reveals areas that are likely to continue growing in value as nearby areas become more desirable.
Methodology
The Liveable Score is based primarily on UK Census data, covering indicators that reflect local stability and prosperity. These include factors such as home ownership, employment, education, and occupational class (NS-SEC), among others.
To allow fair comparisons across Greater Manchester, all statistics were normalised using a percentile method, where the best figure is rated 100 and the worst 0. These normalised scores were then combined to produce the overall Liveable Score. When mapped geographically, the distinctive "Manchester T" pattern of high-scoring areas clearly emerged.
About Liveable.co.uk
Liveable.co.uk is the UK's leading platform for local area insights, ranking over 17,000 areas across England and Wales. Using hyper-local liveability scores, the site gives home movers a data-driven way to compare neighbourhoods, combining factors such as home ownership, employment and education into easy-to-read maps and guides.
The idea for Liveable began in 2024 with a simple spreadsheet. Founder Andrew Hammond started collecting data on towns and suburbs while searching for a new place to live. The spreadsheet grew into an interactive platform that now helps thousands of people explore neighbourhoods more easily.
Full Resolution Images
Manchester T Revealed
Right-click or tap and hold to save the Manchester T on standard map
Liveable Data Visualisation
Right-click or tap and hold to save the Liveable data visualisation